Magnetically active giant stars
Understanding the surface magnetic activity of red giant stars
According to the dynamo theory, stars with convective envelopes develop large scale magnetic fields — causing starspots, which are detectable in the form of pseudo-periodic modulations in photometric data — when their rotation is shorter than their convective turnover time. Most red giants do not have spots because they lose spin while expanding. However, a small fraction of red giants are known to have spots. In a recent paper that I led (Gaulme et al. 2020) we showed that this fraction is about 8% of the red giants. By combining photometric and spectroscopic data, we shed light on the origin of the spotty red giants. We identify three distinct groups: 1) RGs spun up by tidal forces in close binary systems; 2) RGs that engulfed stellar or planetary companions; 3) intermediate-mass RGs that were spinning fast when entering the red giant phase.
See press release on the Max Planck Institute for Solar System Research
Tidally driven magnetic activity of red giants in close binary systems
Red giants in close eclipsing binaries have peculiar photometric properties. Among the 35 Kepler RGs that are confirmed to belong to EBs, half (18/35) display regular solar-like oscillations and no spots. The other half display clear photometric modulation typical of spots, seven with partially suppressed oscillations, and ten do not have detectable oscillations (Gaulme et al. 2014, Rawls et al. 2016, Gaulme et al. 2016, Benbakoura et al. 2021). This is observed in the closest systems, where most orbits are circularized, and rotation periods are either synchronized or in a spin-orbit resonance. Gaulme et al. (2014) suggested that the surface activity and its concomitant mode suppression originate from tidal interactions. During the red giant branch, close binary systems reach a tidal equilibrium where stars are synchronized and orbits circularized. Red giant stars are spun up during synchronization, which leads to the development of a dynamo mechanism inside the convective envelope, leading to surface spots. The magnetic field in the envelope likely reduces the turbulent excitation of pressure waves by partially inhibiting convection. Since spots can also absorb acoustic energy, these two effects lead to the suppression of oscillations.
Stellar pulsations in multiple-star systems
Testing asteroseismology with oscillating red giants in eclipsing binaries
For the past decade, I have led studies about the ability of asteroseismology to provide reliable masses and radii with the help of solar-like oscillators in eclipsing binary systems. Given the importance of asteroseismology for solar-like stars, it is of fundamental importance to identify a set of benchmarks with which to refine the stellar models. Such benchmarks are stars whose main physical properties are known with high precision, especially mass, radius, metallicity, and temperature. So far , all solar-like oscillators in eclipsing binaries are red giants observed by the NASA mission Kepler. I led a first study based on 10 oscillating red giants in eclipsing binaries observed by Kepler and showed that the application of the asteroseismic scaling laws lead to an overestimate of masses and radii by about 15% and 5%, respectively (Gaulme et al. 2016). Updates to this work can be found in former PhD student's paper (Benbakoura et al. 2021). Work is in progress to find more solar-like oscillators in eclipsing binaries.
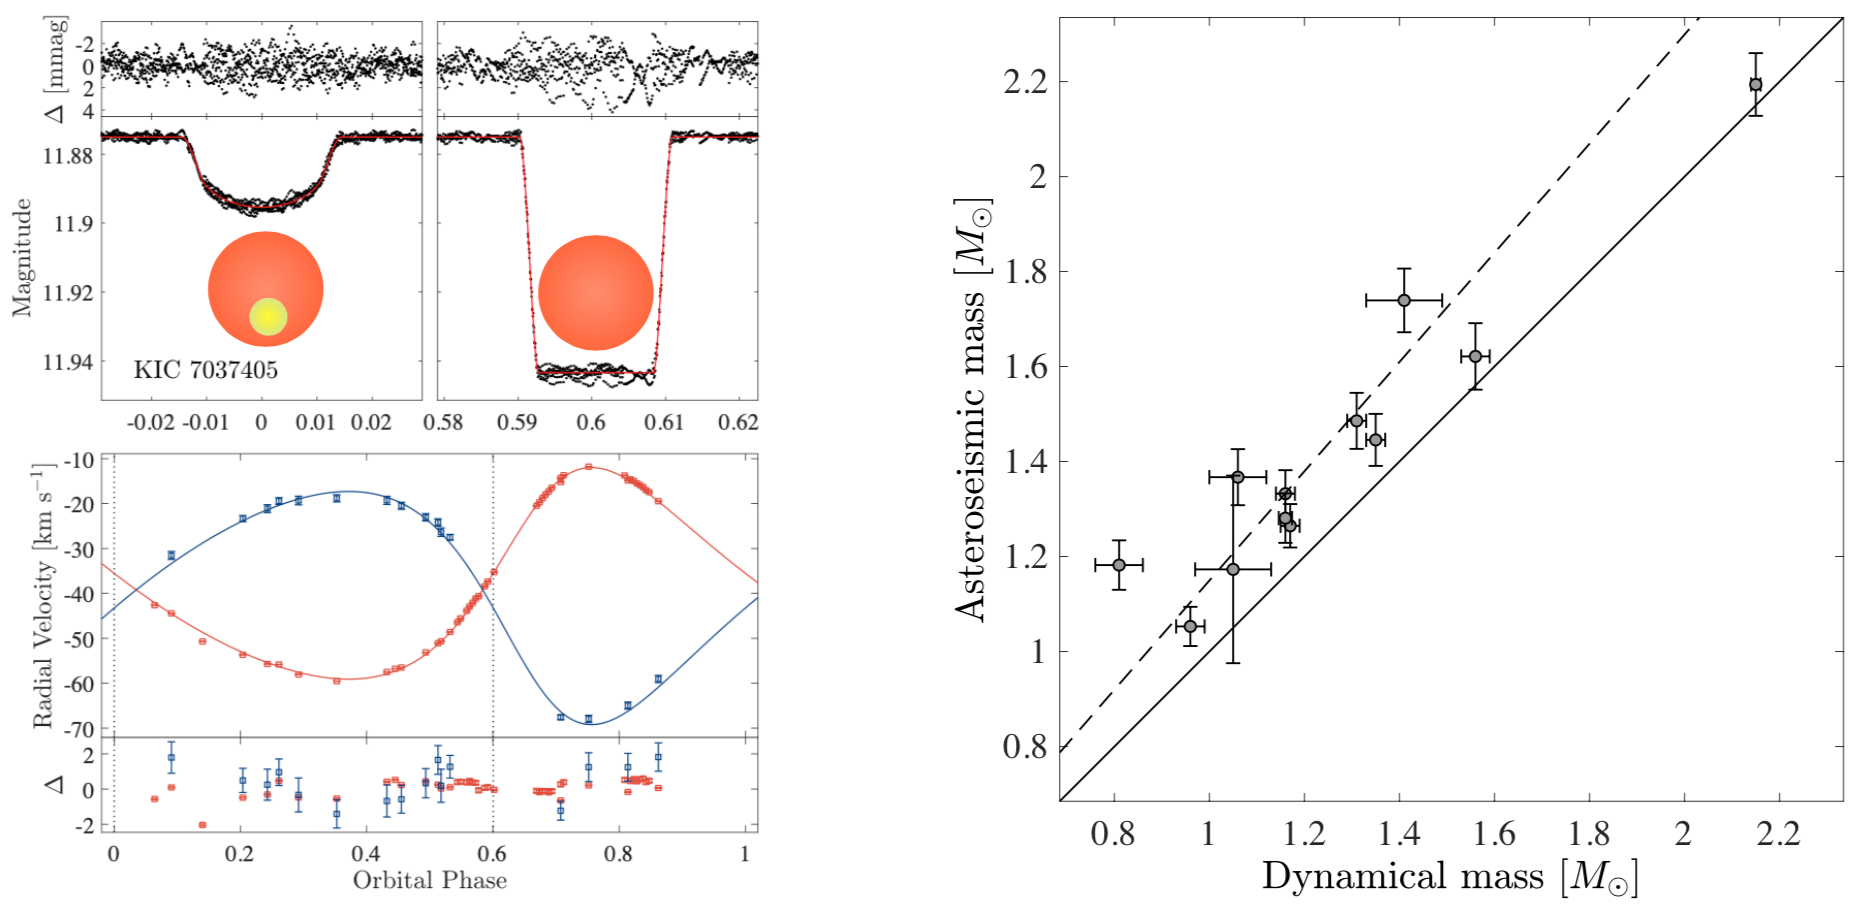
Left panel, top: photometric light curves of the Kepler target KIC 7037405 folded on its orbital period. Left panel, bottom: radial velocity data and its best-fit model. Right panel: asteroseismic versus dynamical masses for the know red giant oscillators in eclipsing binaries.
Systematic search for stellar pulsators in Kepler eclipsing binaries
I led the first systematic search for stellar pulsators in the entire Kepler EB catalog (Gaulme & Guzik 2019). The focus was mainly aimed at discovering delta Scuti, gamma Doradus, red giant, and tidally excited pulsators. I developed a data inspection tool (DIT) that automatically produces a series of plots from the Kepler light curves that allows us to visually identify whether stellar oscillations are present in a given time series. The application of the DIT to the whole Kepler EB database led to identify 303 systems whose light curves display oscillations, including 163 new discoveries. A total of 149 stars are flagged as delta Scuti (100 from this paper), 115 as gamma Doradus (69 new), 85 as red giants (27 new), and 59 as tidally excited oscillators (29 new). There is some overlap among these groups, as some display several types of oscillations. Despite the likelihood that many of these systems are false positives, for example, when an EB light curve is blended with a pulsator, this catalog gathers a vast sample of systems that are valuable for a better understanding of stellar evolution.
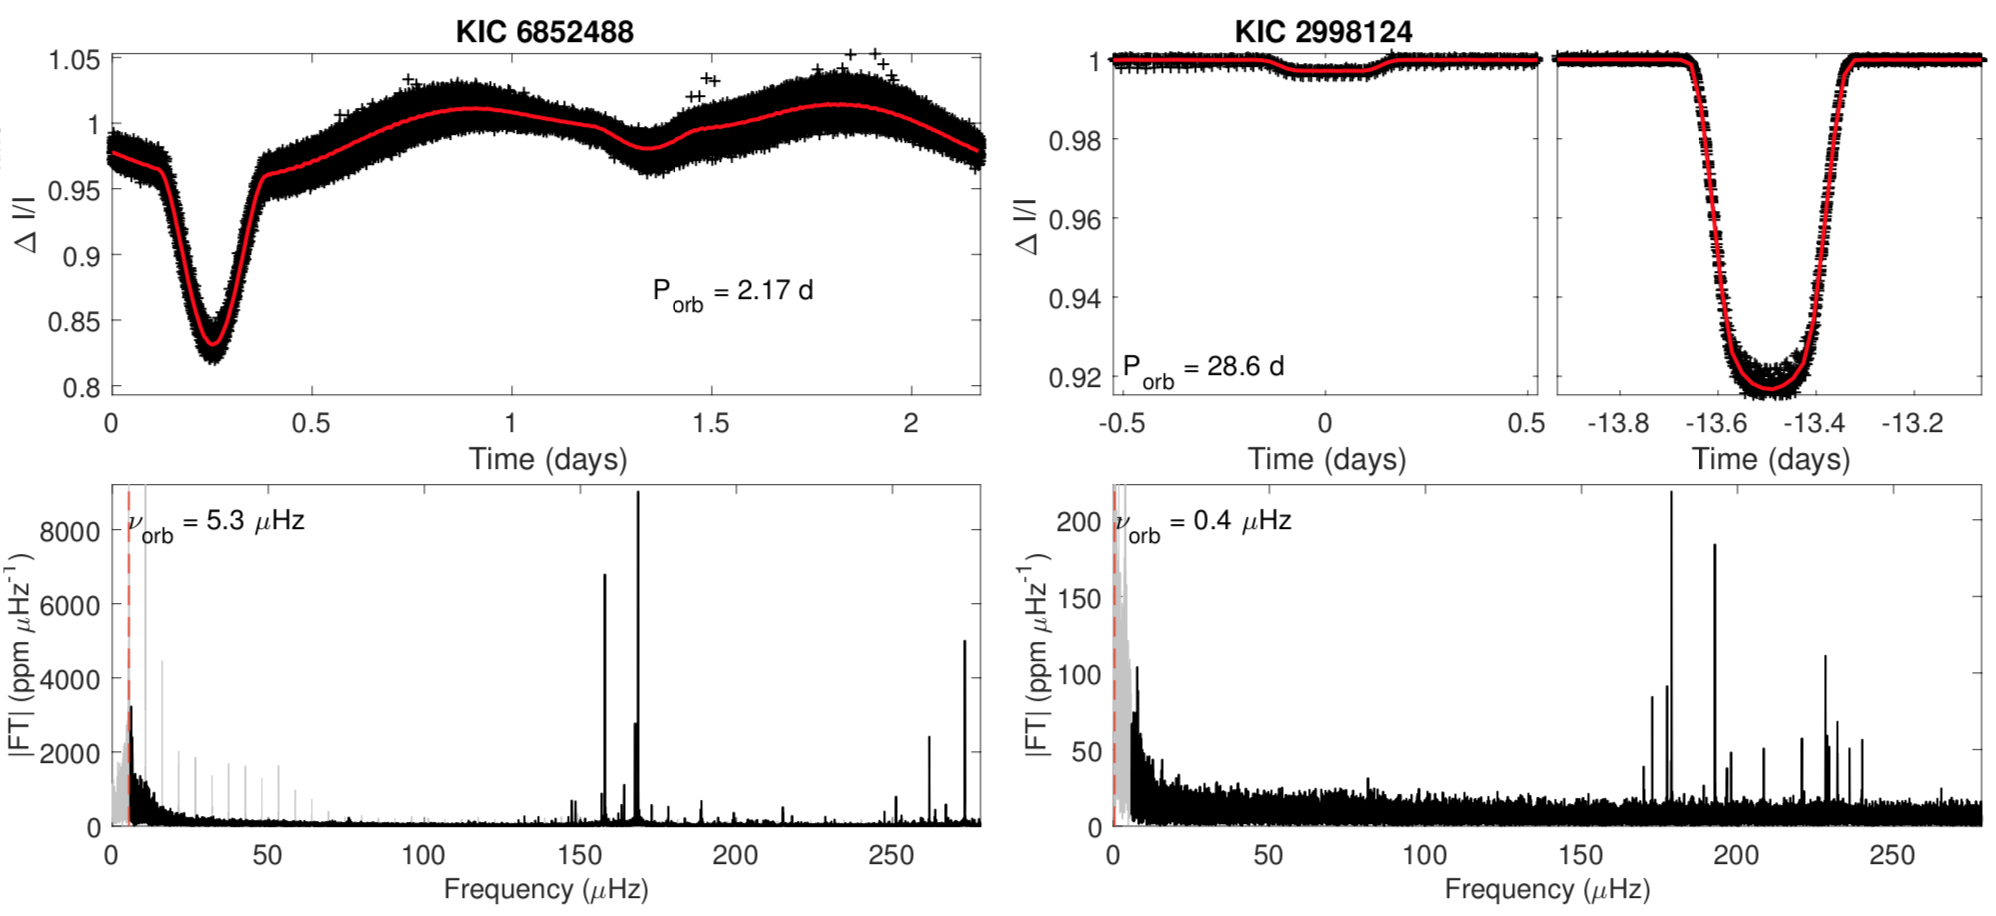
Examples of classical pulsators observed in the light curves of binary systems. The left panel shows the short-period detached system KIC 6852488 in which delta Sct oscillations are clearly visible between 120 and 250 muHz. The asymmetrical dispersion of points around the rebinned folded light curve is caused by the presence of spots that modulate the photometric variations as a function of time. The right panel shows the long-period detached EB KIC 2998124 displaying delta Sct oscillations in the same frequency range. Vertical dashed red lines indicate the orbital frequency.
Seismology of giant planets
Most of my early career efforts were dedicated to the search of the oscillations of Jupiter. The idea was to apply helioseismic techniques to giant planets, and Jupiter is a priori the easiest target by being the closest, biggest and thus brightest of all. I first looked whether high-precision photometry similar to the VIRGO instrument onboard the SOHO solar mission or to the CoRoT, Kepler, and TESS exoplanetary missions could be suitable for this objective. I then got much involved in the ground-based imaging spectrometer SYMPA, led by François-Xavier Schmider in Nice (Schmider et al. 2007), which eventually led to the clearest evidence of Jupiter's oscillations so far (Gaulme et al. 2011). Now, SYMPA is retired and has evolved into the JOVIAL/JIVE multi-instrumental ground-based project.
Possible detection of oscillations of Jupiter
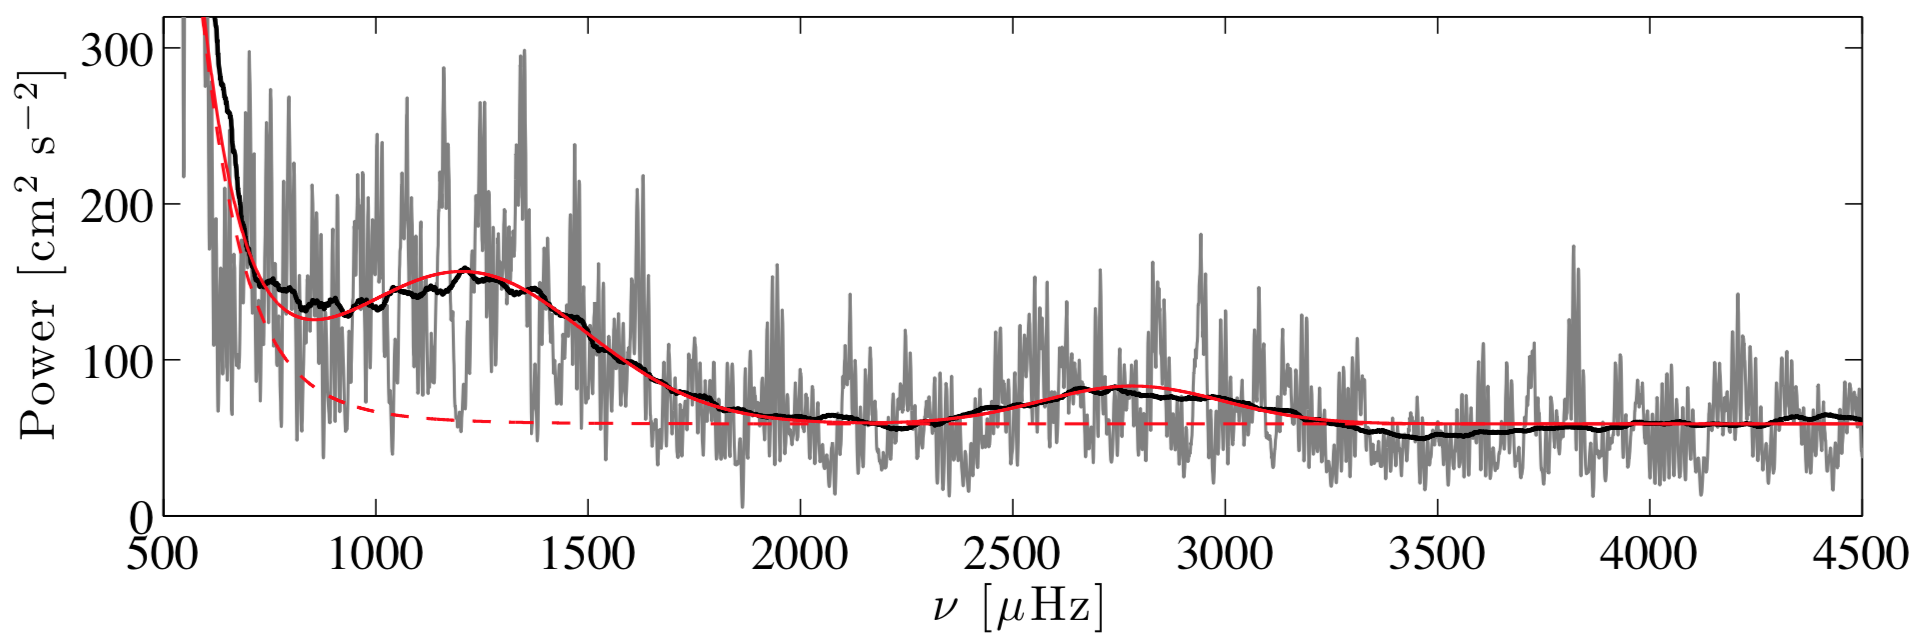
Power spectrum of the dataset obtained with the SYMPA instrument on Jupiter in 2005 at Teide Observatory (from Gaulme et al. 2011). The oscillations of Jupiter are characterized both by the increase in power between 800 and 3500 μHz, and the regular spacing of the modes (∆ν = 155 μHz). The decrease of the mode amplitude around 2000 μHz suggests that the propagation of acoustic modes in the upper atmosphere may be a function of frequency. See press release on the Observatoire de la Côte d'Azur
Exploring the possibility of using high-precision photometry to detect oscillations of giant planets
The question of employing space-borne visible photometry to track the motions caused by acoustic modes in Jupiter's atmosphere was the topic of my PhD thesis (see PDF in French ) and my first paper (Gaulme & Mosser 2005). Such a solution would have been excellent news given its simplicity relatively to Doppler spectroscopy or thermal infrared imaging. Unfortunately, as I showed in my PhD and first paper, it is hard to answer to this question because Jupiter's atmosphere is not a mirror that reflects the solar flux. It is actually wrapped by a relatively heterogeneous cloud layer that may react to the acoustic oscillations. Indeed an pressure perturbation applied to a thermodynamical system at equilibrium such as a cloud will change the ratio of condensed versus gas matter. The result could have photometric implications. Given a lack of accuracy regarding the abundances in the upper atmosphere of Jupiter, it was nearly impossible to decide whether Jupiter's clouds would react as a photometrical amplifier or suppresser of the oscillation modes. Impossible then to fund a space-borne mission (even microsat) based on this uncertainty.
Thankfully, we could test such a technique for free, by observing Neptune for about 50 days and Uranus for about 30 days with K2. The planets saturated the detector and it was uneasy to recover the photometry. However, it ended up having a clean photometric time series of Neptune, which did not lead to any significant detection of planetary oscillations... despite we clearly detected the solar oscillations!

Observation of Neptune with the extended Kepler mission K2. Left panel shows a saturated Neptune on the Kepler detector (see movie, and Rowe, Gaulme, et al. (2017)). Right is the power spectrum of the K2 time series as a function of frequency (gray and black line), where Neptune's rotation (blue peaks) solar oscillations are detected. For comparison the green line is the smoothed (100 bins) power density spectrum of the VIRGO/SPM light curve taken simultaneously with K2 data (from Gaulme et al. 2016).
Atmospheric dynamics in the solar system
The art of measuring atmospheric dynamics with imaging spectroscopy
Most knowledge about atmospheric dynamics of the planets of the solar system has been obtained with cloud-tracking technique, which consists of tracking visible features from images taken at different dates. Doppler imaging is as challenging (motions can be less than 100 m s−1 ) as it is appealing because it measures the speed of cloud particles instead of large cloud structures. A significant difference between wind speed measured by cloud-tracking and Doppler spectroscopy is expected in case of atmospheric waves interfering with cloud structures. In Gaulme et al. (2018) we provide a theoretical basis for conducting accurate Doppler measurements of planetary atmospheres, especially from the ground with reflected solar absorption lines. In particular, we show how the Earth atmospheric seeing impacts such measurements by both lowering the zonal wind velocity amplitude and by modifying the apparent location of the planet in the sky. We also provide the first complete mathematical description of the Young effect, which is an artificial radial velocity field caused by the solar rotation that mimics a retrograde planetary rotation.
Measuring the super rotation of Venus at the cloud-top level
In Gaulme et al. (2018) we measure the global properties of the atmospheric dynamics of Venus at the altitude of the uppermost clouds, which is probed by reflected solar lines in the visible domain. Our results are based on high-resolution spectroscopic observations with the long-slit spectrometer of the solar telescope THEMIS. In this paper, we actually produced the first instantaneous “radial-velocity snapshot” of any planet of the solar system in the visible domain, i.e., a complete radial- velocity map of the planet obtained by stacking data on less than 10% of its rotation period. From this, we measured the properties of the zonal and meridional winds, which we unambiguously detect. We identify a wind circulation pattern that significantly differs from previous knowledge about Venus. The zonal wind reveals a “hot spot” structure, featuring about 200 m/s at sunrise and 70 m/s at noon in the equatorial region. Regarding meridional winds, we detect an equator-to-pole meridional flow peaking at 45 m/s at mid-latitudes, i.e., about twice as large as what has been reported so far.
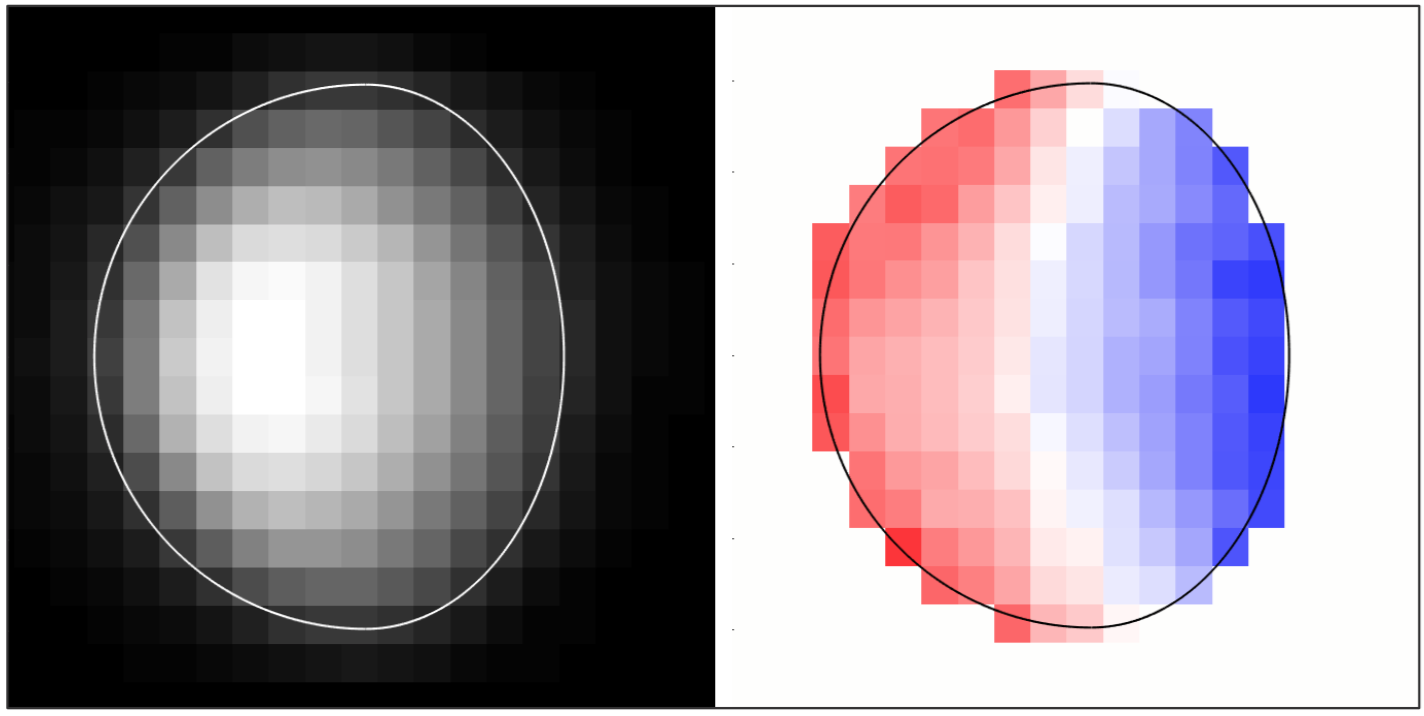
From left to right: photometric and Doppler maps of Venus obtained from 2009 data take with the long-slit solar spectrometer of the THEMIS observatory. Colors indicate redshift/blueshifts and the color bar indicates the Doppler shift in m/s. The white and black contours indicates the theoretical size of the planet on the detector and the maps are oriented such as north is on top. Pixel size is about 0.8 × 0.8 arcsec.
Measuring the latitudinal wind profile of Jupiter
Gonçalves, Schmider, Gaulme et al. (2019) present the first scientific results of the new instrument JOVIAL, whose prototype was the Jupiter seismograph SYMPA. As a first project, we tested the ability of the instrument to measure the differential rotation of Jupiter, a.k.a. its latitudinal wind profile, which had never been done with visible spectroscopy. Again, all the knowledge about Jupiter's rotation come from cloud tracking techniques. Our results are consistent between the two years. We compare the results with wind profiles obtained by cloud tracking on HST (Hubble Space Telescope) images taken at the same epoch, and identify a significant discrepancy in the North Equatorial Belt and northern part of the Equatorial Zone. Now, three instruments are being built and will be mounted on the Dunn solar telescope at Sunspot (NM, USA), 1-m telescope at Calern (France), and 1.88-m telescope at Okayama (Japan). A first zonal wind maps could be produced from data taken at Okayama in 2019 (Schmider et al. 2020).
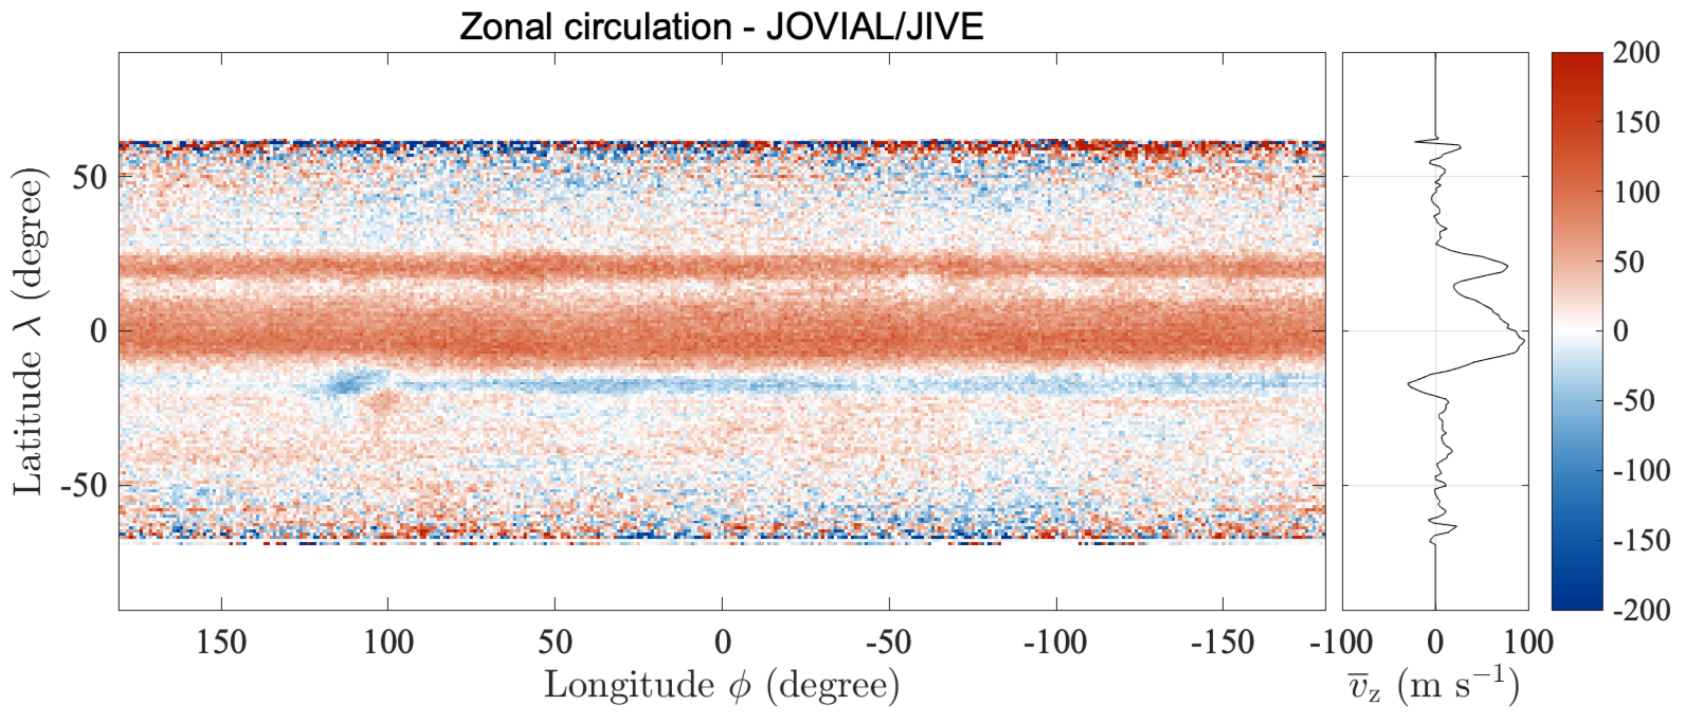
Planisphere of the zonal winds obtained on May 29th, 2019 obtained with JOVIAL at the 1.88-m telescope of the Okayama observatory. The vertical scale is in m/s, counted positively for prograde winds. The great red spot is clearly visible at latitude -20 degree and longitude 50 degree. From Schmider et al. (2020).

